Quarterly PSN Top Guns List published by Zephyr identifies best-in-class separate accounts, managed accounts, and managed ETF strategies
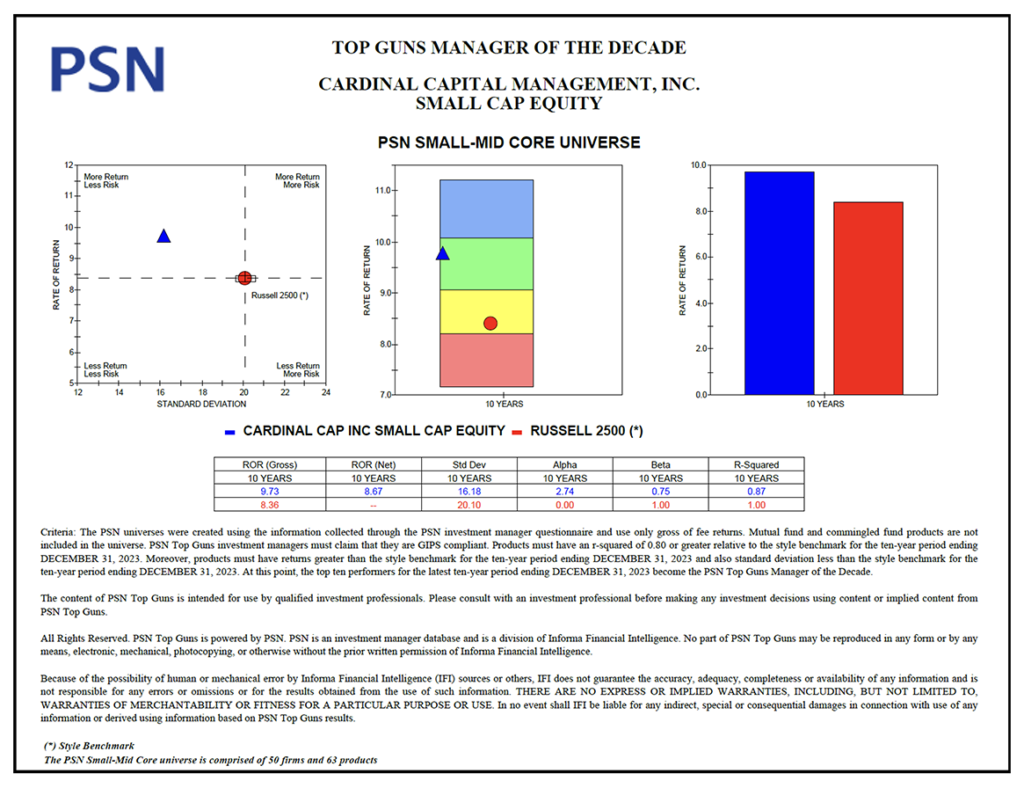
Raleigh, NC—February 22, 2024 — Cardinal Capital Management, Inc. (“Cardinal Capital”) is proud to announce it has been named Small Cap Equity Manager of the Decade by Zephyr’s PSN Top Guns List for the Small-Mid Cap Universe as of 4thQ 2023. This prestigious designation marks the firm’s fifth “Manager of the Decade” award over Cardinal Capital’s 32-year history. The highly anticipated list, published by Zephyr, remains one of the most important references for investors and asset managers. The Manager of the Decade recognition has now been awarded to all of Cardinal Capital’s U.S. strategies.
“As the needs and viewpoints of investors are becoming more diverse, investment advisors must incorporate strategies capable of being customized to their client’s goals. Separately Managed Account (“SMA”) strategies are becoming increasingly important as an efficient tool to provide custom investment solutions for portfolios of all sizes and have seen asset growth of over 19% in 2023. It is also increasingly important for managers to Identify quality SMA strategies Zephyr PSN has been helping advisors find quality products for 40 years and achieving Top Gun status confirms that Cardinal Capital has outperformed their peers in a meaningful way.” Said Nick Williams Product Manager of PSN at Zephyr.
Cardinal Capital Management’s Small Cap Core equity portfolio is comprised of high-quality small cap companies, generally up to $3 billion in market capitalization at the time of investment, trading at attractive prices. The Small Cap Core equity portfolio seeks long-term capital appreciation with lower volatility to enhance the portfolio’s overall risk-adjusted returns.
“We are incredibly honored to receive this recognition for the fifth time,” said Glenn C. Andrews, CFA, President and Chief Investment Officer of Cardinal Capital. “It is a testament to our team’s dedication and expertise in delivering value to our clients through a proven investment approach.”
Through a combination PSN’s proprietary performance screens, the PSN Top Guns List ranks products in six proprietary categories in over 75 universes based on continued performance over time.
Cardinal Capital’s Small Cap Equity strategy was named Top Gun Small Cap Equity Manager of the Decade, meaning our Small Cap Equity strategy had an r-squared of 0.80 or greater relative to the style benchmark for the latest 10-year period. Moreover, the strategy’s returns were greater than the style benchmark for the latest 10-year period and also standard deviation less than the style benchmark for the latest ten-year period. At this point, the top ten performers for the latest 10-year period become the PSN Top Guns Manager of the Decade.
The complete list of PSN Top Guns and an overview of the methodology can be located at https://psn.fi.informais.com/. Registration is required.
About Cardinal Capital Management, Inc.
Cardinal Capital Management Inc. is an independent registered investment management firm established in 1992, that manages equity, fixed income and balanced assets for their clients. The company’s clients include individuals, trusts, and foundations. Cardinal Capital Management claims compliance with the Global Investment Performance Standards (GIPS®). A complete list of composite descriptions and compliant presentations are available by calling (919) 532-7500 or contacting Wes Andrews at wandrews@cardinalcapitalmanagement.com. For more information, please visit http:// www.cardinalcapitalmanagement.com.
About PSN
For nearly four decades, PSN has been a top resource for investment professionals. Asset managers rely on Zephyr’s PSN to effectively reach institutional and retail investors. Over 2,800 firms, 285 universes, and more than 21,000 products comprise the PSN SMA database showing asset breakdowns, compliance, key personnel, ownership diversity, ESG, business objectives and strategy, style, fees, GIC sectors, fixed income ranges and full holdings. Unique to PSN is its robust historical database of nearly 40 Years of Data Including Net and Gross-of-Fee Returns. For more details on the methodology behind the PSN Top Guns Rankings or to purchase PSN Top Guns Reports, contact Robby Resendez at PSNdata@informais.com Visit PSN online to learn more.


Cardinal Capital Management Disclaimer
Performance results represent composite results for the Balanced strategy managed by Cardinal Capital Management, Inc. (“Cardinal”) during the corresponding time periods. The performance results reflect the reinvestment of dividends and other account earnings, and are net account transaction and custodial charges, and Cardinal’ s investment management fee except for those performance returns that are compared to other similarly benchmarked managers (for example, managers whose performance is compared to a blended benchmark comprised of 60% S&P 500 Composite Index and 40% Bloomberg Barclays Government Credit Index) in charts which results were prepared utilizing investment managers database and the PSN investment managers database which are reported gross of investment management fees, including Cardinal management fee- (see Gross of Fees disclosure below).
Past performance may not be indicative of future results. Therefore, no current or prospective client should assume that future performance will be profitable, or equal either the Cardinal performance results reflected or any corresponding historical benchmark index. The S&P 500 Composite Index (the “S&P) is a market capitalization-weighted index of 500 widely held stocks often used as a proxy for the stock market. Standard & Poor’s chooses the member companies for the S&P based on the market size, liquidity, and industry group representation. Included are the common stocks of industrial, financial, utility, and transportation companies. The historical performance results of the S&P (and those of or all indices) do not reflect the deduction of transaction and custodial charges, nor the deduction of an investment management fee, the incurrence of which would have the effect of decreasing indicated historical performance results. The historical S&P performance results (and those of all other indices) are provided exclusively for comparison purposes only, so as to provide general comparative information to assist an individual client or prospective client in determining whether the performance of a Cardinal portfolio meets, or continues to meet, his/her investment objective(s). It should not be assumed that Cardinal account holdings will correspond directly to the S&P or any other comparative index. The Cardinal performance results do not reflect the impact of taxes.
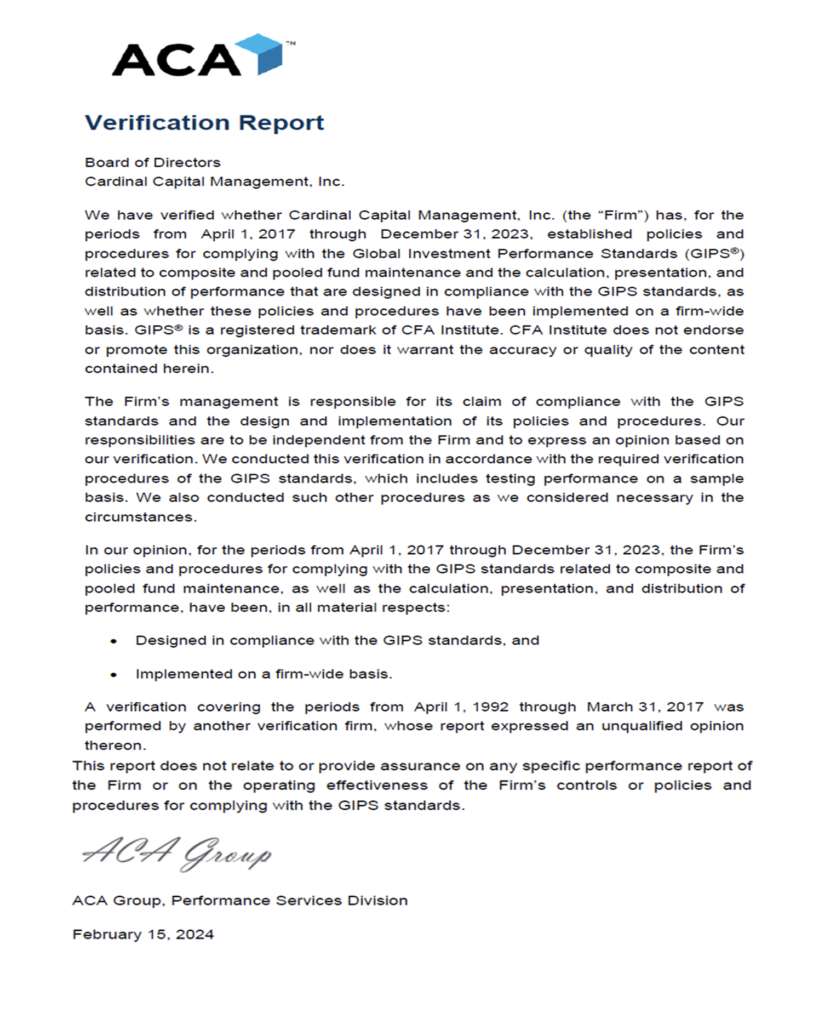
For reasons including variances in portfolio account holdings, variances in the investment management fee incurred, market fluctuation, the date on which a client engaged Cardinal’s investment management services, and account contributions or withdrawals, the performance of a specific client’s account may have varied substantially from the indicated Cardinal portfolio performance results. Cardinal Capital Management’s compliance with the GIPS standards has been verified for the period April 1, 2017 through December 31, 2024 by ACA Performance Services LLC and between the periods April 1, 1992 through March 31, 2017 by Ashland Partners & Company LLP. In addition, a performance examination was conducted on the Balanced composite beginning October 31, 1992 through December 31, 2024. A copy of the verification report is available upon request. Information pertaining to Cardinal’s advisory operations, services, and fees is set forth in Cardinal’s current disclosure statement a copy of which is available from Cardinal upon request.
Gross of Fees (charts from PSN investment managers database) Comparative managers’ investment performance is shown in these charts gross of their management fees and Cardinal’s investment performance is shown gross of Cardinal’s investment management fees (as described in Cardinal’s written disclosure statement), the incurrence of which will have the effect decreasing the composite performance results (for example: an advisory fee of 1% compounded over a 10-year period would reduce a 10% return to a 9% annual return).
